A resilient future, engineered
A resilient future, engineered
Engineering-based building vulnerability. The missing layer in traditional natural hazard risk modeling.
Iris uses component-level engineering models to show how buildings respond to extreme events, giving you a more defensible measure of risk and a clearer path to reducing it.
Decision-grade. Property-specific. Portfolio scale.
Engineering-based building vulnerability. The missing layer in traditional natural hazard risk modeling.
Iris uses component-level engineering models to show how buildings respond to extreme events, giving you a more defensible measure of risk and a clearer path to reducing it.
Decision-grade. Property-specific. Portfolio scale.


Built by engineers. Designed for decision-makers.
Built by engineers. Designed for decision-makers.
Class 3 was born out of Arup, the global engineering consultancy behind some of the world’s most complex built environment projects. Our founders have designed buildings to withstand disasters.
We originally built Iris to scale the kind of physical risk assessments Arup’s engineers were delivering, without sacrificing consultant-grade rigor. That means asset-specific estimates of damage, downtime, and financial loss that are traceable to the components that drive them and can stand up to scrutiny. And the ability to test realistic interventions to see which resilience investments actually reduce risk.
Today, owners, operators, investors, lenders, and their advisors can use that same methodology directly to go from rapid portfolio screening to investment-grade analysis of the assets and decisions that matter most.
Class 3 was born out of Arup, the global engineering consultancy behind some of the world’s most complex built environment projects. Our founders have designed buildings to withstand disasters.
We originally built Iris to scale the kind of physical risk assessments Arup’s engineers were delivering, without sacrificing consultant-grade rigor. That means asset-specific estimates of damage, downtime, and financial loss that are traceable to the components that drive them and can stand up to scrutiny. And the ability to test realistic interventions to see which resilience investments actually reduce risk.
Today, owners, operators, investors, lenders, and their advisors can use that same methodology directly to go from rapid portfolio screening to investment-grade analysis of the assets and decisions that matter most.
One platform, end-to-end
Go from an address to decision-grade risk and resilience intelligence across an entire portfolio.

Portfolio management
Custom tags, hierarchical grouping, and bulk import. Group by class, geography, fund, or vintage.
The portfolio view scales from 20 assets to 2,000 without changing the workflow.
Asset coverage
Commercial, residential, industrial, and infrastructure assets.
Hundreds of pre-computed archetypes, each built on the same fragility and consequence functions used in full engineering studies.

13 hazards. Present day to 2100.
Flood, wind, wildfire, seismic, and climatological hazards modeled across SSP pathways and IPCC time horizons.
Resolution up to 3m in select regions, 30m globally.

Risk aggregation
Every asset plotted with its risk profile.
Color-coded by hazard rating, filterable by hazard type, zoomable from continental overview to individual building.
Risk communication
Qualitative ratings for fast comparison, with full quantitative detail one click deeper.
Organizations configure their own risk rating matrices aligned to their risk appetite.
Export-ready from day one
CSV, Excel, PDF reports, GIS overlays, and REST API.
Compatible with financial models, compliance templates, and regulatory reporting frameworks.
Component-level insights
Component-level insights
Iris models how building systems fail and the cost and time to recover operations. Defend high-stakes decisions with component by component traceability.
Envelope
Exterior walls, windows, exterior doors
Roofing
Roof membrane, roof deck, equipment
Structural
Walls,
beams and columns, braces
Facades
Curtain walls, cladding, anchors and connections

Mechanical
Chillers, air handling units, ductwork
Architectural
Interior partitions, suspended ceilings, flooring
Electrical
Switchgear, generators, distribution panels
Plumbing
Risers and mains, fixtures, water heaters
Built on leading hazard science








When risk scores
aren't enough
When risk scores
aren't enough
From global technology companies to institutional investors, the teams that need defensible answers choose Iris.
Iris gave us something we never had before: a defensible, traceable view of climate risk across our entire data center portfolio. The engineering depth is real.
Climate Risk Lead
Major technology company
Sector
Data center infrastructure
Portfolio scope
200+ sites globally
Focus
C2 risk assessment, real-time monitoring
Hazards modeled
Flood, wind, wildfire, heat, ice
Iris gave us something we never had before: a defensible, traceable view of climate risk across our entire data center portfolio. The engineering depth is real.
Climate Risk Lead
Major technology company
Sector
Data center infrastructure
Portfolio scope
200+ sites globally
Focus
C2 risk assessment, real-time monitoring
Hazards modeled
Flood, wind, wildfire, heat, ice
Iris gave us something we never had before: a defensible, traceable view of climate risk across our entire data center portfolio. The engineering depth is real.
Climate Risk Lead
Major technology company
Sector
Data center infrastructure
Portfolio scope
200+ sites globally
Focus
C2 risk assessment, real-time monitoring
Hazards modeled
Flood, wind, wildfire, heat, ice
Frequently
Asked Questions
Frequently
Asked Questions
How is Iris different from other climate risk tools?
Iris uses a component-based engineering methodology that analyzes actual building systems and their physical failure modes. Most tools assign scores based on coarse hazard grids and generic building assumptions. Iris can keep going where existing screening tools stop. Our bottom-up approach produces traceable, defensible consequences outputs that you can trust: repair costs, downtime, and revenue loss tied to specific hazard intensities and specific building components.
How is Iris different from other climate risk tools?
Iris uses a component-based engineering methodology that analyzes actual building systems and their physical failure modes. Most tools assign scores based on coarse hazard grids and generic building assumptions. Iris can keep going where existing screening tools stop. Our bottom-up approach produces traceable, defensible consequences outputs that you can trust: repair costs, downtime, and revenue loss tied to specific hazard intensities and specific building components.
How is Iris different from other climate risk tools?
Iris uses a component-based engineering methodology that analyzes actual building systems and their physical failure modes. Most tools assign scores based on coarse hazard grids and generic building assumptions. Iris can keep going where existing screening tools stop. Our bottom-up approach produces traceable, defensible consequences outputs that you can trust: repair costs, downtime, and revenue loss tied to specific hazard intensities and specific building components.
What hazards and geographies do you cover?
Flood: riverine, stormwater, and coastal + sea-level rise
Wind: cyclonic, tornadic, straight-line wind
Geophysical: earthquake shaking
Climatological: wildfire, extreme heat, extreme cold, drought, snow, ice storm
Datasets and maps from leading climate modelers, all in one place.
Global coverage. Enhanced flood resolution: up to 10m in select regions, 30m globally.
Probabilistic and return-period intensity metrics selected for their relevance to damage.
Most hazards include climate change projections following IPCC standards across present-day, mid-century, and end-of-century timeframes, using multiple climate models and emission pathways (SSP scenarios).
What hazards and geographies do you cover?
Flood: riverine, stormwater, and coastal + sea-level rise
Wind: cyclonic, tornadic, straight-line wind
Geophysical: earthquake shaking
Climatological: wildfire, extreme heat, extreme cold, drought, snow, ice storm
Datasets and maps from leading climate modelers, all in one place.
Global coverage. Enhanced flood resolution: up to 10m in select regions, 30m globally.
Probabilistic and return-period intensity metrics selected for their relevance to damage.
Most hazards include climate change projections following IPCC standards across present-day, mid-century, and end-of-century timeframes, using multiple climate models and emission pathways (SSP scenarios).
What types of assets can you assess?
Individual buildings and portfolios across all major property types: we have pre-assembled hundreds of archetypes across offices, data centers, hospitals, industrial facilities, logistics warehouses, retail, residential, and specialized structures, using our component-based approach.
You can model individual buildings component by component directly in Iris, down to the bolts.
Generate new archetypes, specific to your use case, using the same methodology.
What types of assets can you assess?
Individual buildings and portfolios across all major property types: we have pre-assembled hundreds of archetypes across offices, data centers, hospitals, industrial facilities, logistics warehouses, retail, residential, and specialized structures, using our component-based approach.
You can model individual buildings component by component directly in Iris, down to the bolts.
Generate new archetypes, specific to your use case, using the same methodology.
How does Iris model risk?
Iris breaks risk into the three components behind every catastrophe model: hazard, vulnerability, and exposure.
Hazard: how likely an event is and at what intensity. Iris quantifies exposure at the building footprint from probabilistic provider data, with intensities expressed as return-period values (e.g., flood depth at the 100-year event).
Vulnerability: how damageable the building is. Iris models it at the component level (structural, mechanical and electrical, and building envelope), with fragility functions relating hazard intensity to the probability of damage at each severity level.
Exposure: what the building and its components are worth and how they are used. Occupancy type, replacement cost, component inventory, and the number and sensitivity of occupants all feed the model.
Together they produce a probabilistic distribution of loss and downtime for the asset.
How does Iris model risk?
Iris breaks risk into the three components behind every catastrophe model: hazard, vulnerability, and exposure.
Hazard: how likely an event is and at what intensity. Iris quantifies exposure at the building footprint from probabilistic provider data, with intensities expressed as return-period values (e.g., flood depth at the 100-year event).
Vulnerability: how damageable the building is. Iris models it at the component level (structural, mechanical and electrical, and building envelope), with fragility functions relating hazard intensity to the probability of damage at each severity level.
Exposure: what the building and its components are worth and how they are used. Occupancy type, replacement cost, component inventory, and the number and sensitivity of occupants all feed the model.
Together they produce a probabilistic distribution of loss and downtime for the asset.
Do you support regulatory climate disclosures?
Yes. Iris outputs are compatible with TCFD, EU Taxonomy (CSRD), SFDR, SB261, and other major disclosure frameworks. We provide multiple climate scenarios including mid-century and end-of-century projections, with standardized exports formatted for compliance reporting.
Report by fund, business group, geography, rentable area, and much more.
Do you support regulatory climate disclosures?
Yes. Iris outputs are compatible with TCFD, EU Taxonomy (CSRD), SFDR, SB261, and other major disclosure frameworks. We provide multiple climate scenarios including mid-century and end-of-century projections, with standardized exports formatted for compliance reporting.
Report by fund, business group, geography, rentable area, and much more.
What kind of reports and data do I get?
PDF reports with maps and executive summaries, CSV/Excel exports for portfolio analysis, and API access for system integration.
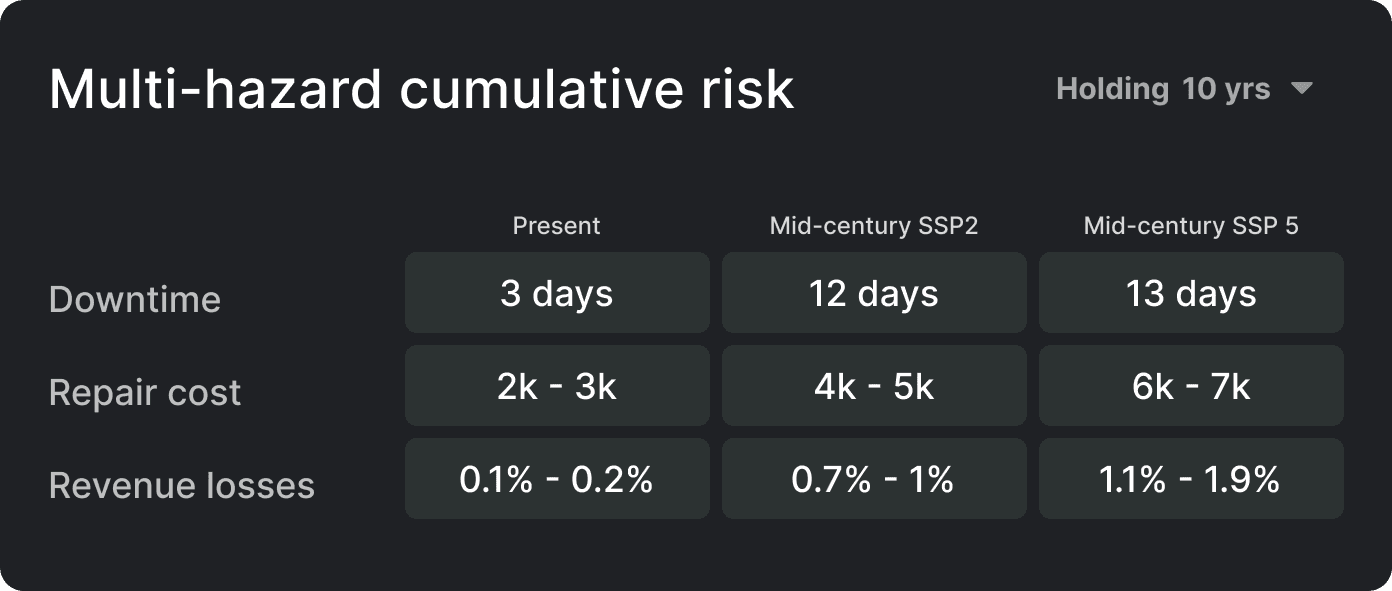
All outputs include risk ratings and detailed impact metrics: repair costs and downtime, with options to include revenue loss, inventory loss, life safety, heat misery index, and heat-induced hospitalizations. Results are delivered with probabilistic ranges (10th, 50th, 90th percentiles).
What kind of reports and data do I get?
PDF reports with maps and executive summaries, CSV/Excel exports for portfolio analysis, and API access for system integration.
All outputs include risk ratings and detailed impact metrics: repair costs and downtime, with options to include revenue loss, inventory loss, life safety, heat misery index, and heat-induced hospitalizations. Results are delivered with probabilistic ranges (10th, 50th, 90th percentiles).
Who uses the Iris platform?
Asset owners and operators for resilience planning and capital prioritization. Investors and lenders for acquisition due diligence and portfolio risk management. Risk professionals, including insurers, engineering consultants, and advisory firms, for client-facing risk modeling and advisory services.
Our users range from single-campus owners to institutions managing global portfolios of thousands of buildings.
Who uses the Iris platform?
Asset owners and operators for resilience planning and capital prioritization. Investors and lenders for acquisition due diligence and portfolio risk management. Risk professionals, including insurers, engineering consultants, and advisory firms, for client-facing risk modeling and advisory services.
Our users range from single-campus owners to institutions managing global portfolios of thousands of buildings.
How does your pricing structure work?
We use a consumption-based token system where different assessment types consume different amounts of tokens based on complexity (see the Class taxonomy under Methodologies) and data requirements.
Pricing includes base license fees plus token consumption, with volume discounts available.
Contact us for a customized quote based on your specific requirements.
How does your pricing structure work?
We use a consumption-based token system where different assessment types consume different amounts of tokens based on complexity (see the Class taxonomy under Methodologies) and data requirements.
Pricing includes base license fees plus token consumption, with volume discounts available.
Contact us for a customized quote based on your specific requirements.
How quickly can I get results, and do I need special expertise?
Class 0 assessments return results instantly. Just input an address or coordinates.
Class 1 assessments take minutes with basic building information like occupancy type and height category.
Class 2 assessments benefit from more building insights, including vintage, structural type, finish floor elevation, and more, typically validated through review of property reports, drawings, and street views.
Class 3 assessments involve full engineering-grade analysis with site-specific data collection, typically scoped as a project engagement with an advisory partner,with results delivered through the platform.
How quickly can I get results, and do I need special expertise?
Class 0 assessments return results instantly. Just input an address or coordinates.
Class 1 assessments take minutes with basic building information like occupancy type and height category.
Class 2 assessments benefit from more building insights, including vintage, structural type, finish floor elevation, and more, typically validated through review of property reports, drawings, and street views.
Class 3 assessments involve full engineering-grade analysis with site-specific data collection, typically scoped as a project engagement with an advisory partner,with results delivered through the platform.